Hana Chockler, Daniel Kroening, Youcheng Sun
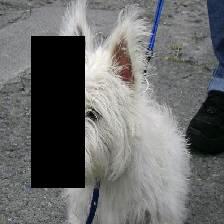
Existing algorithms for explaining the output of image classifiers perform poorly on inputs where the object of interest is partially occluded. We present a novel, black-box algorithm for computing explanations that uses a principled approach based on causal theory. We have implemented the method in the DeepCover tool. We obtain explanations that are much more accurate than those generated by the existing explanation tools on images with occlusions and observe a level of performance comparable to the state of the art when explaining images without occlusions.
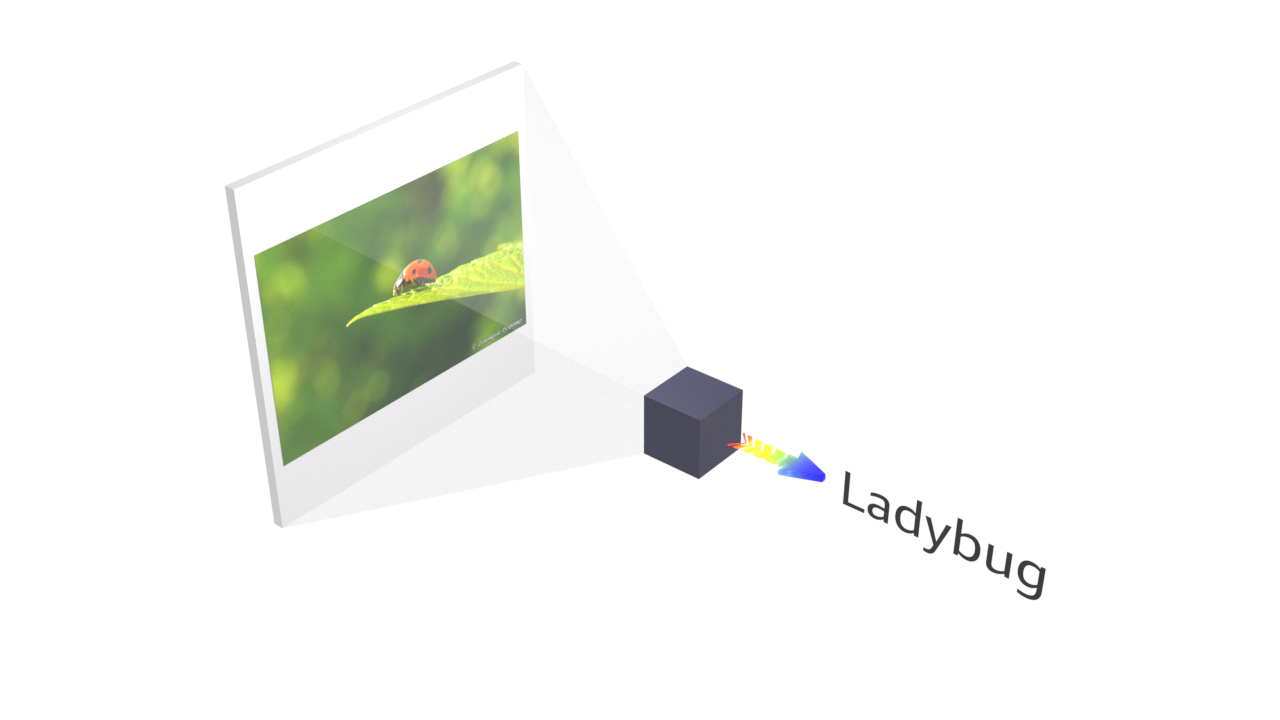
We work with a given black-box image classifier, which takes an image as input and calculates a label as output.
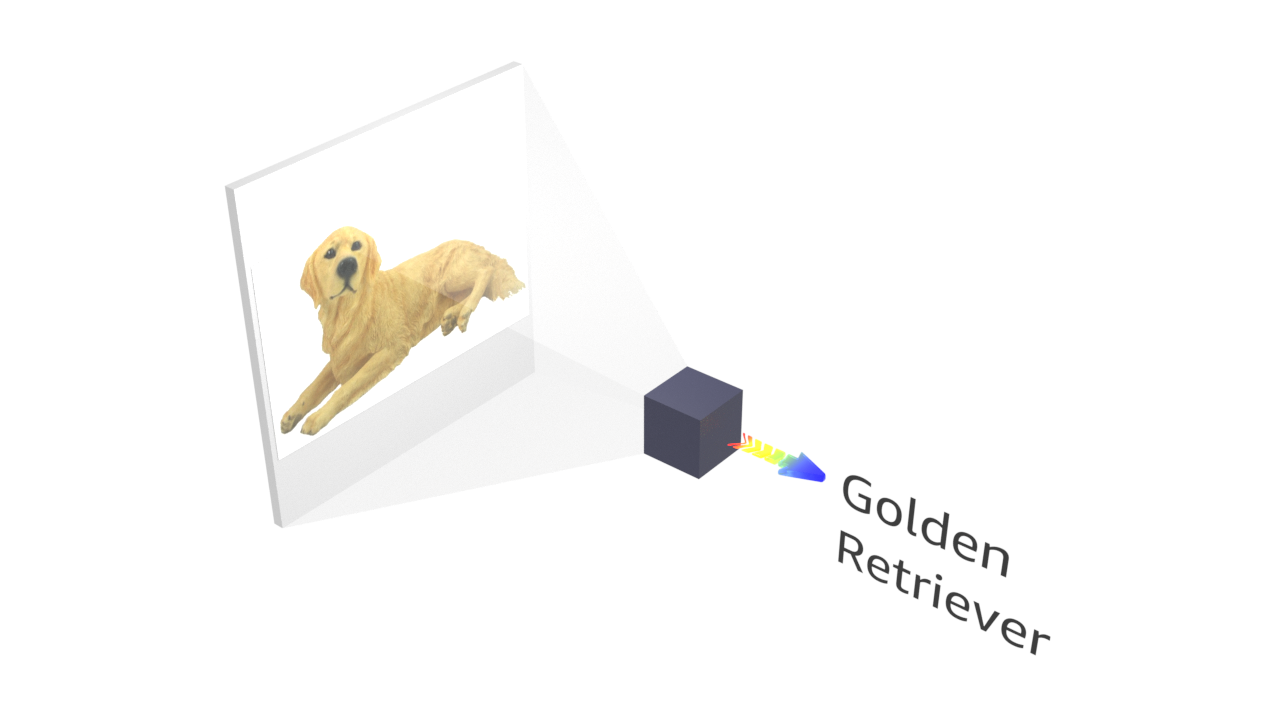
Explanations for the results of image classifiers are typically based on or are given in the form of a ranking of the pixels, which is a numerical measure of importance: the higher the score, the more important the pixel is for the DNN's classification outcome.
A user-friendly explanation can then be a subset of the highest-ranked pixels that is sufficient for the original classification outcome.
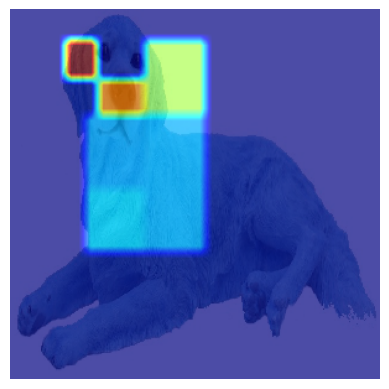
We partition the image into superpixels. The general idea is to calculate the responsibility of a superpixel and recursively distribute this responsibility to all pixels within this superpixel.
| ✓ | = | classified like original image |
| ✗ | = | classification has changed |
The degree of responsibility of a superpixel is calculated as the minimum difference between a mutant image and the original image over all mutant images that do not mask the superpixel, are classified the same as the original image, and masking the superpixel changes the classification.
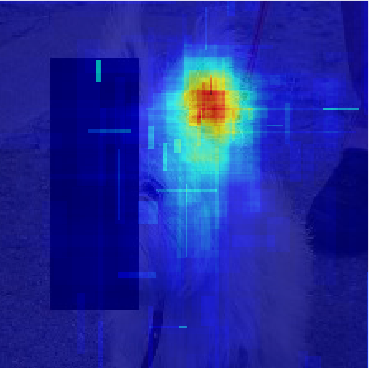
We repeate the algorithm above N times, which yields N heatmaps. We then compute an average of the degrees of responsibility given by each of these heatmaps. The accuracy of the average increases with the number of iterations.
#iterations:
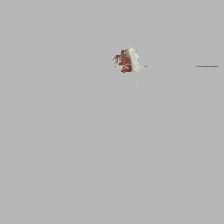
We add pixels to the explanation, in the order given by the ranking, as long as the classifier's output on does not match the original label.
 |
 |
 |
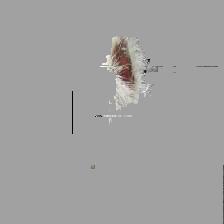 |
| original image | averaged heatmap | top % pixels | final explanation |
We compare with DC-Causal, GBP, Extremal, Rise, RAP, LRP and IG. TODO: Add links.
